


title: Bitcoin Has Entered the 91-Day Window That Ended Its Last Three Bear Markets meta_description: Two methods point to a Bitcoin bottom in the $42,000 to $47,000 zone by October. The shrinking drawdown pattern across three cycles tells you why each bear market hurts less than the last. slug: bitcoin-91-day-bear-market-window-42000-47000-bottom category: Bitcoin tags: Bitcoin bear market, Bitcoin price prediction, Bitcoin bottom 2026, Bitcoin cycle, BTC price analysis focus_keyword: Bitcoin bear market bottom 2026
Bitcoin Has Entered the 91-Day Window That Ended Its Last Three Bear Markets
Bitcoin’s last three bear markets each ended the same way. A brutal stretch of selling, a bottom, and then a recovery that erased most of what the bear took.
The 91-day window for this cycle started in early July. Bitcoin is currently at $62,865, down roughly 53% from its October 2025 peak of $126,793. That puts this cycle’s current drawdown in line with where previous cycles were heading into their final leg down.
Two independent methods, a linear regression on past bear market total drawdowns and a logarithmic Fibonacci retracement, both point toward the $42,000 to $47,000 zone by early October as the likely bottom range for this cycle.
The Pattern Across Four Cycles
The data is clean enough to be worth taking seriously. Bitcoin’s peak-to-trough drawdowns across every major bear market show a consistent trend.
History has repeated itself for Bitcoin
The EMA crossover indeed preceded additional downside$BTC #Bitcoin https://t.co/NZvrheCeid pic.twitter.com/rnkmYwH8vS
— Rekt Capital (@rektcapital) July 7, 2026
The 2011 bear market erased 93% from peak to trough. The 2013 to 2015 cycle bottomed after an 86% decline. The 2018 bear market took 84% off the peak before recovering. The 2021 to 2022 cycle, ending with the FTX collapse, produced a 77.5% drawdown to $15,587.
Four cycles. Four bottoms. Each one painful, and each one shallower than the last.
The current cycle has already declined 53% from the $126,793 peak. That is the mildest drawdown at this stage of any previous bear market, which is consistent with the pattern. A linear regression on the four completed cycles projects the next total drawdown somewhere in the 65% to 70% range before bottoming. Applied from the $126,793 peak, a 65% to 70% total decline puts the bottom between roughly $38,000 and $44,000.
The logarithmic Fibonacci retracement produces a similar answer from a completely different direction. Running the retracement from the $126,793 all-time high down to the $15,587 prior cycle low, the key levels tell a clear story about where Bitcoin sits right now.
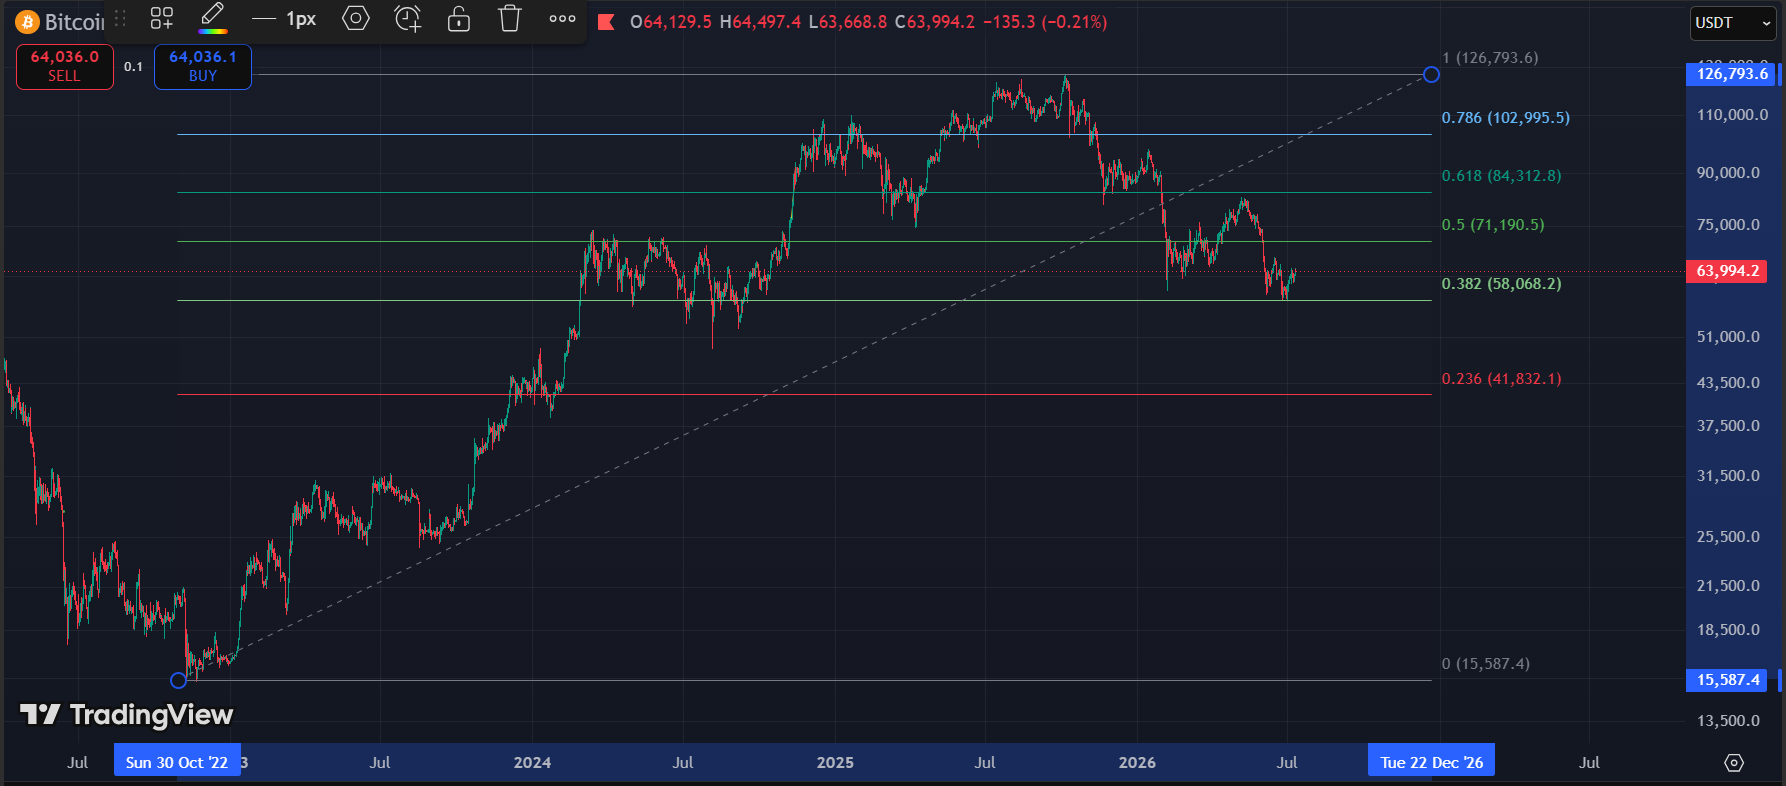
Bitcoin has already broken below the 0.5 Fibonacci level at $71,190. The 0.382 at $58,068 held as the June low. A break below it opens the path toward the $41,832 to $47,431 convergence zone. Source: TradingView
Bitcoin has already broken below the 0.5 level at $71,190, which means the midpoint of the entire advance from the 2022 low has been surrendered. The 0.382 level at $58,068 is the next meaningful support, and it is notable that Bitcoin found its June low in exactly that zone before recovering to current levels around $63,994. Price is now sitting between the 0.382 and 0.5 levels, in the middle of the two key Fibonacci supports.
Below the 0.382, the 0.236 level at $41,832 is the next structural floor. The regression target of $47,431 sits between those two levels, $41,832 and $58,068, which is where the two methods converge. A sustained break below $58,068 on a weekly close would open the path toward that zone. In the 2022 cycle, Bitcoin bottomed just above the 0.5 log Fibonacci level before recovering. This cycle, having already broken below the midpoint, the structure is slightly weaker than 2022 at the equivalent stage.
Why Each Bottom Hurts Less Than the Last
The shrinking drawdown pattern is not random. It is the same dynamic that makes Bitcoin’s returns smaller with each successive cycle.
A market that required $697 billion in fresh capital to generate a 689% gain this cycle is a market that can absorb selling pressure it could not have handled in 2014. Spot Bitcoin ETFs now anchor a large share of demand. Institutional desks, deeper derivatives markets, and a market cap measured in the trillions all blunt the force of every selloff. Large whale wallets kept accumulating through June’s decline, a pattern that tends to slow declines that once ran unchecked.
The same maturity that makes 50,000% returns impossible now makes 90% total drawdowns equally unlikely. The ceiling and the floor both moved in the same direction as Bitcoin grew up.
That is either reassuring or disappointing depending on what you bought Bitcoin for.
What Would Break the Model
The sample is three data points. That is enough to take the pattern seriously, not enough to bet the house on it.
A hawkish Fed extending rate hikes into October would add pressure the model does not account for. ETF outflows returning to June levels would do the same. The CLARITY Act failing in the Senate would remove one of the few remaining near-term catalysts for fresh institutional capital.
On the other side, the model could be too pessimistic. Bitcoin may have already put in a higher-than-projected bottom. The $58,000 area held during June’s worst selling. If that becomes the floor rather than the $42,000 to $47,000 zone, the cycle is running ahead of the historical pattern rather than behind it.
The $58,068 Fibonacci level at the 0.382 retracement is the line to watch in the near term. It sits just below current prices and held as support during June’s worst selling. A sustained weekly close below it would open the path toward the $41,832 to $47,431 convergence zone. A hold above it would suggest the bottom is already in at the June low.
Either way, early October is the window the pattern points to. The three previous cycles ended their worst quarter in that same timeframe. Whether this one does too is the question the next 91 days will answer.